Discovery
Research into the Problem Space
We started with background research, but parachute packing is very complicated and involves many variables. We needed to go to the site and observe firsthand how parachute packers did their jobs. We performed a contextual inquiry at Fort Gregg-Adams, which helped us empathize with our users and reveal key pain points. From our findings, we were able to create 4 insights.
There are two main groups of people involved in parachute packing
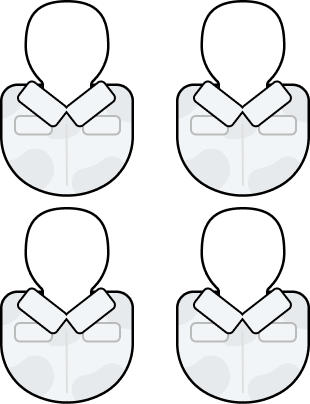
Riggers
Their job is to pack 15 parachutes a day. There are 4 riggers per 1 inspector. They often have to wait around for inspectors to check their parachute.

Inspectors
They are experienced packers that patrol pack floors and inspect rigger packs during rigger checks. They have many inspections to perform.
Insight 01
Small, inefficient tasks add up throughout the day, wasting time and reducing manpower
The process is rigid and monotonous, with many small steps and rigger checks
Insight 02
Rigger reliance on inspectors is a bottleneck for packing efficiency
On average, every day there are
performed by an inspector
Statistics calculated based on data from Fort Gregg-Adams
Insight 03
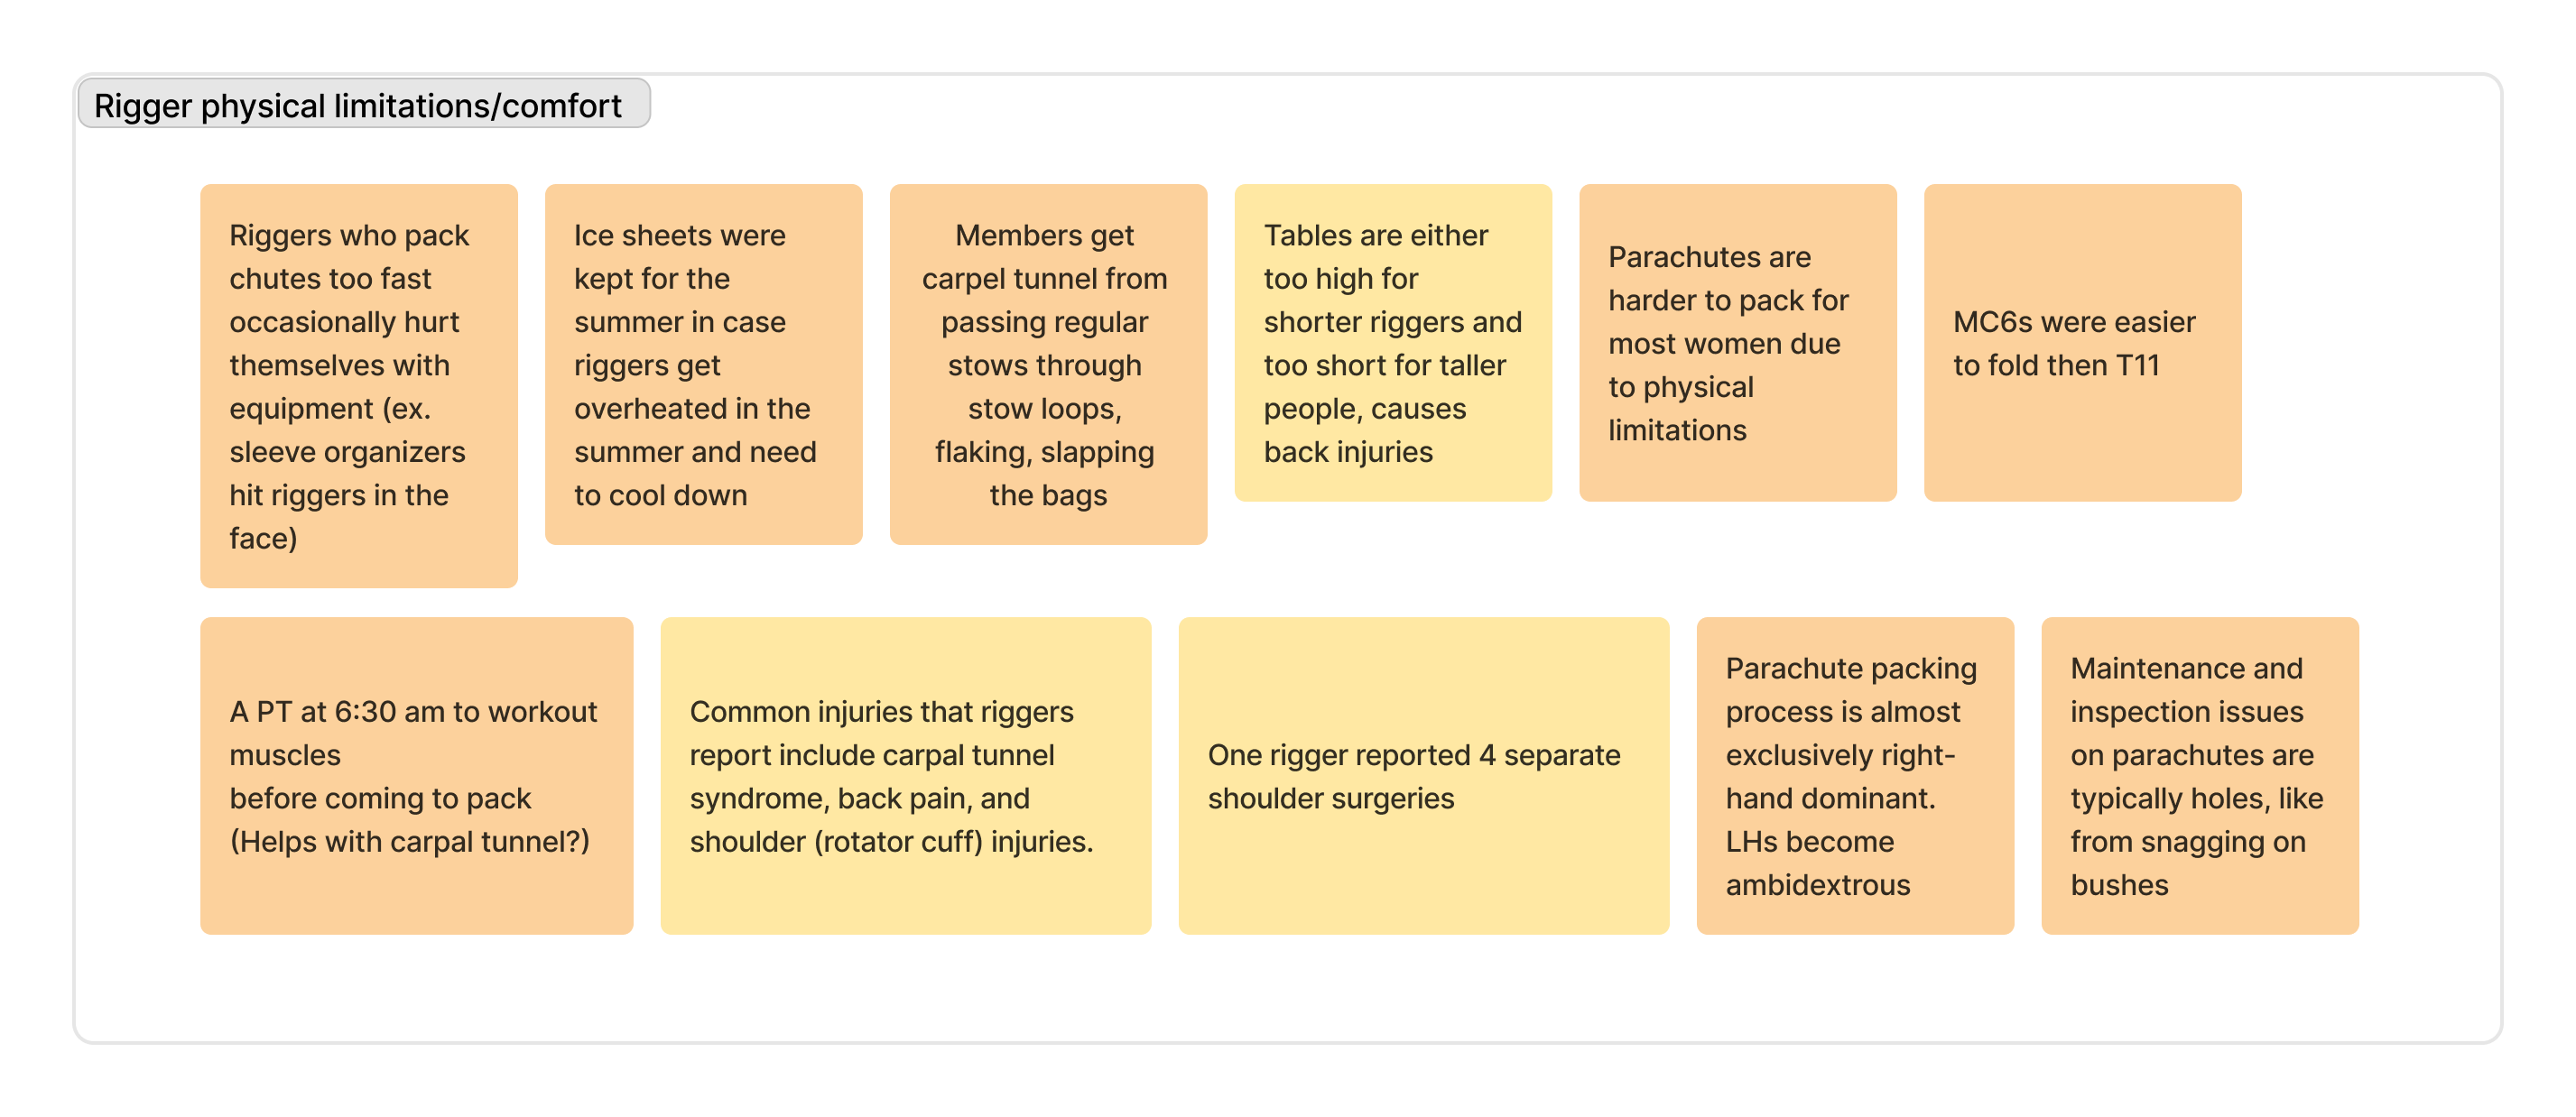
The one-size-fits-all process disregards individual ergonomics, resulting in strain and injury

Injury is inevitable
Riggers reported that injury was not an "if", but a "when". Carpal tunnel, back, shoulder and neck strain, or more serious problems came with the job.
Individuals face different physical impacts
Tall riggers have to hunch over the packing tables, while short riggers have to strain themselves to reach across the tables.
Insight 04
Limited variability and collaboration makes work monotonous, impacting morale and job satisfaction
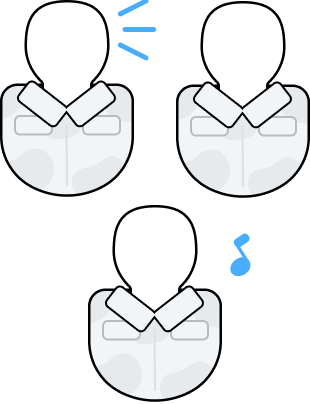
Packing culture is important
Riggers would "trash talk" and compete with one another to make time pass faster and bond. They would also play music to break up monotony and energize each other. Collaboration was not allowed, however.
Riggers can't quantify the important work they are doing
They pack 15 parachutes a day, every day, which adds up over time. But only daily packs are tracked, so their long term progress is lost.
Synthesis
Finding areas of opportunity
Now that we have identified insights, we can turn them into areas of opportunity. We wanted to balance client needs of accuracy, efficiency, and worker retention.
Streamlining the inspection process will increase rigger efficiency
A shift towards a more adaptable process can foster a healthier work environment and boost productivity
We can increase rigger engagement and satisfaction by addressing the monotonous nature of parachute packing
By optimizing parts of the parachute packing process, we can free up manpower and improve efficiency
Our guiding principles
Final Solution
Smart Table & Hub System
I created all 3D renders using Blender
We have designed multiple solutions that work together as a system to streamline the packing process, collect packing data, and improve ergonomics and morale. At the center of our system is the packing table, where riggers pack parachutes.
The Brain
Rigger Check Waitlist
We designed a dashboard that can be used by both riggers and inspectors. It is linked to 4 pack tables, the rigger simply chooses which table they prefer. Inspectors can watch the hub to identify incoming rigger checks more clearly, eliminating the inspection bottleneck.
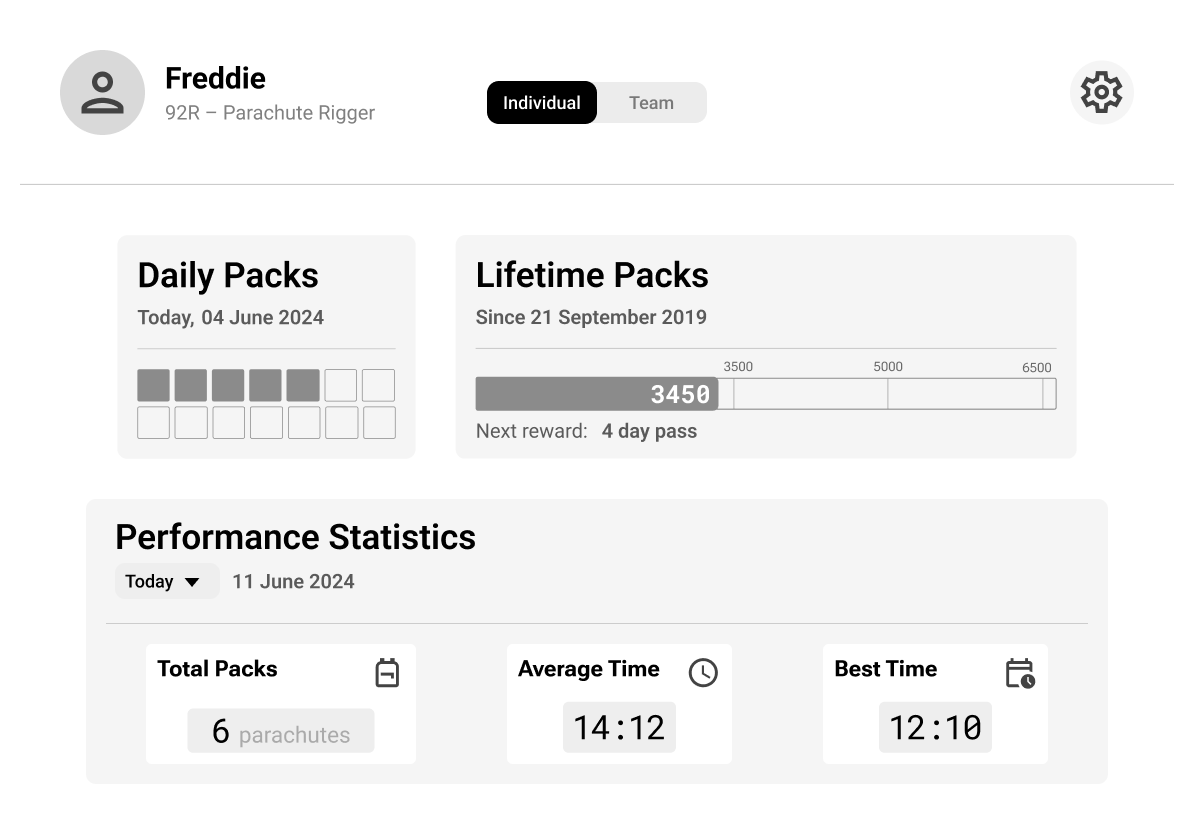
Personal & Team Stats
Riggers can check their metrics, such as average time per pack, or total lifetime packs, whenever they prefer. They can also compare each other's stats, fostering healthy competition.
Key Improvements
Competition & Morale
Healthy competition, banter, and camaraderie are important to riggers, so seeing one another's stats will help support this culture

Alleviating Small Tasks
Tasks like filling out the form on each parachute, or keeping track of tools throughout the day, are eliminated through the use of the hub

Data Collection
Rigger data can be collected and displayed, which helps quantify data in ways that are tangible to riggers
The core
Height Adjustment
The Smart Table will communicate with the Hub and automatically adjust the height to the rigger's preset position, accommodating different rigger needs.
Conductive Strip & Light Signal
The rigger can call for an inspection by double-tapping a conductive strip underneath the table. The light will turn on and the Hub will display the rigger's order in line. This streamlines the rigger check process and makes it easier to tell which rigger called for an inspection.
Key Improvements

Health & Safety
Improved ergonomics reduces strain. With less riggers harmed when working, more personnel are available to pack
Efficiency
By optimizing working conditions and reducing latency caused by rigger checks, packing efficiency will improve
Data Collection
Time between rigger checks can be tracked, as well as the inspector's performance
A deeper look
The Design Process
01 Research
First we learned about the basics of parachute packing, then we jumped into analogous domain research.
What similar products or systems exist?
Amazon & IKEA
These warehouses manage large inventories similar to pack floors
Origami and Sail- making
Fabric or other material is folded in complex ways
Airbags & other Deployables
The big parachute must fit into a small bag, similar to airbags
Tents & Sleeping Bags
Large products with complicated fabrics are manufactured with automation
We drove down to Fort Gregg-Adams to perform a contextual inquiry. Using the AEIOU method, we looked at Activities, Environment, Interactions, Objects, and the User. I asked many questions, took notes, and observed the user's daily life.
Key Findings
Activities – Packing parachutes, performing inspections
Environment – Loud, messy, hectic
Interactions – Banter & camaraderie were important
Objects – Many tools to keep track of, packing table
Users – Rigger and inspector
02 Synthesis
We took all of our findings and sorted them into groups based on similarities. From there, we could find common patterns and extract insights.
Key Findings
- There was a high incentive for efficiency, but it must be balanced with high accuracy & mission demands
- Banter/competition was important for rigger culture
- Riggers were prone to injuries, especially from poor ergonomics
- A range of incentives were motivating to riggers
- Pack floors were extremely loud and overstimulating
A few relevant affinity clusters
While creating our insights, we also wanted to make a user journeymap. However, I thought it would be beneficial to map the pain points to each step of the packing process. Different physical stressors and injuries are accrued at different stages, so visualizing them all would help us target pain points better for solutioning.
03 Design
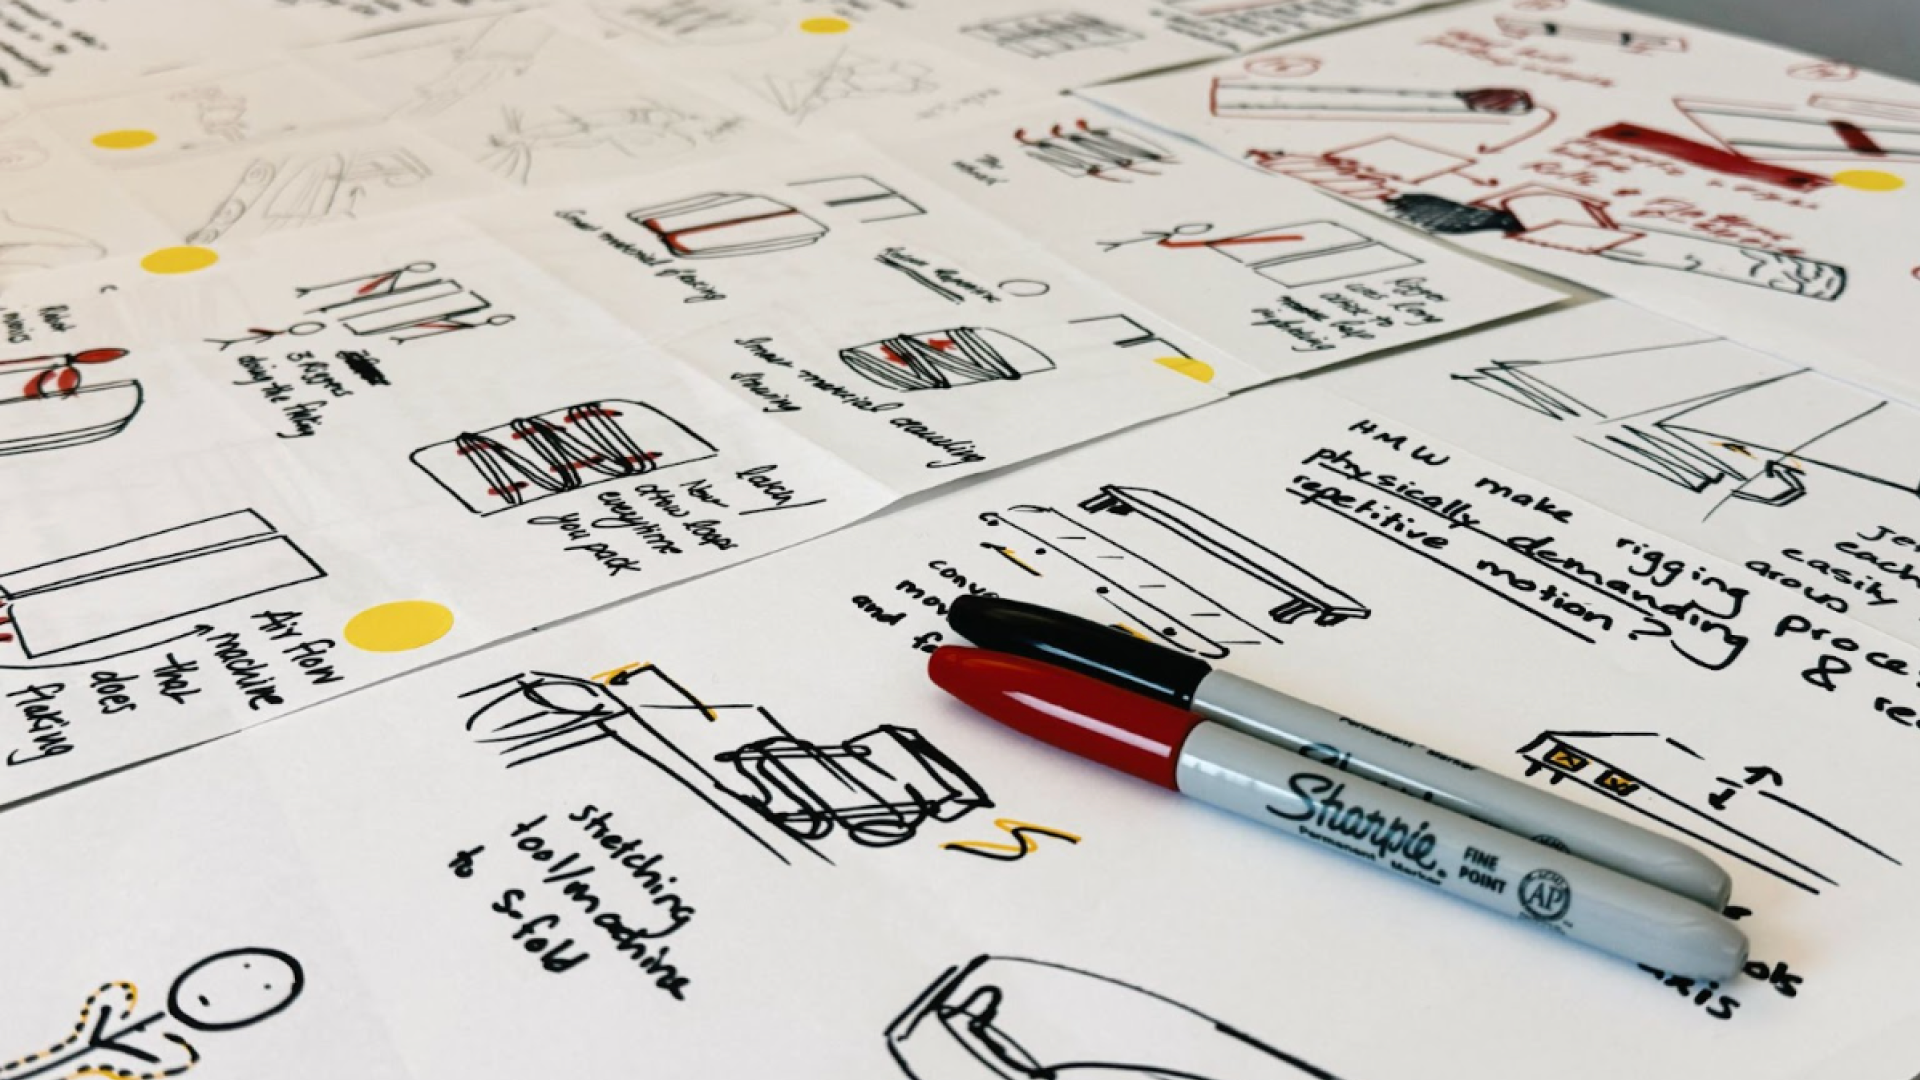
Since we had principles to guide us, we could begin to brainstorm potential solutions. The problem scope was so broad, and we created so many concepts, that we had to sort them into categories to ensure we were addressing key areas of opportunity.
Concept Categories
- Ergonomics & physical assistance
- Workflow automation & tooling
- In-process monitoring & data collection
- Organizational changes (not feasible)
I drew low-stakes depictions of our four main ideas using Adobe Photoshop for concept validation with our client.
We moved forward with the smart table and rigger dashboard
04 Testing
We made low-fidelity screens of a rigger dashboard that displays personal stats including performance stats, and daily/lifetime packs. These stats would be embedded into the pack table so the rigger could view their stats in real-time.
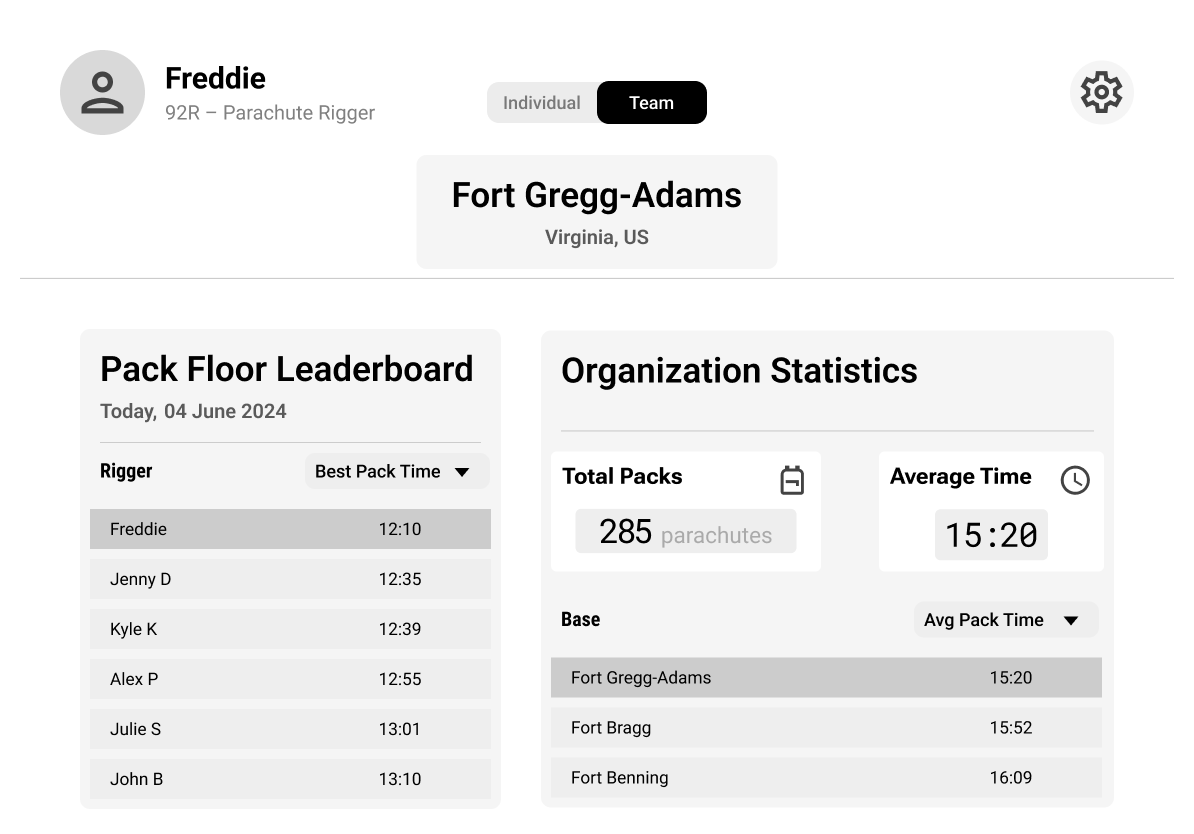
There is also a team section that shows leaderboards for that pack floor or different forts. This was to foster healthy competition and a shared goal of beating other forts.
We designed two testing protocols: one for testing the dashboard, and one for testing the overall flow of the new solution ecosystem. The dashboard user testing involved think-aloud protocol and semi-structured interviews. We wanted to test if riggers understood how to navigate the dashboard, and their understanding and reaction to the displayed metrics. For testing the system flow, we instructed them broadly on how to use the new system using my 3D renders, then observed their behavior as they packed with our prototype conductive strip, scanner, lights, and dashboard. After, we asked them questions about the process in a semi-structured interview.
Key Findings
01
The embedded dashboard would break
We kept having to move our iPad (the "embedded dashboard"), out of the way while riggers worked to avoid damage. Riggers confirmed that anything fragile near the pack table would break.
02
The overall flow was streamlined
Riggers quickly understood the interactions in our new system and liked how quick and easy they were. The conductive strip and light signaling had especially positive feedback.
03
Constant display of statistics was stressful
Riggers reported that real-time performance stats was actually discouraging to them. Riggers may get tired throughout the day, so seeing such minute changes would be stressful.
We pulled in inspectors to get their perspective on the dashboard. This is where the idea for an inspector-facing hub was formed. Together, we ideated a centralized dashboard, situated near the pack tables, that helped both riggers and inspectors.
Our Impact
Outcomes
Riggers, inspectors, and our clients at ADFSD had very positive reactions to our designs. User testing showed that both riggers and inspectors could understand our new solution ecosystem. Our clients plan on taking our prototypes to DEVCOM for testing and development. Our users were especially excited about the adjustable smart table, they felt it would truly help alleviate their health problems.


